On this page
An infographic maker is an online design tool that turns information into a visual using templates, icons, charts, and, increasingly, AI drafts. The best one depends on your material. Story-led graphics with a few numbers suit Canva, Venngage, or Piktochart. Chart-heavy work suits Infogram or a specialist like Datawrapper. Branded team work suits Visme.
Below, we compare six all-round infographic makers and three specialist data tools. For each, you'll see how it works, who it suits, the skills it expects, what its AI actually does, what it connects to, and what it costs.
Prices checked between November 11 and November 22, 2026, on each vendor's own pricing page. Prices change often, so confirm before you buy.
- Pick Canva for speed and variety, Infogram for interactive charts and live data, and Venngage or Piktochart for business infographics on a budget.
- Venngage, Piktochart, and Visme can all turn a prompt or uploaded document into an editable infographic draft. Treat that draft as a starting layout, not a finished piece.
- Piktochart Pro and Venngage Premium both cost $10 per month on annual billing, the lowest paid tiers we compared.
- Datawrapper, Flourish, and RAWGraphs are lesser-known specialist tools that make more accurate charts than most all-round makers.
- No tool decides what matters in your data. Choosing the one point your graphic makes is still your job.
Best Infographic Makers at a Glance
Most infographic makers look alike in screenshots. The differences show up in how they handle data, how much skill they expect, and what their free plans let you export.
| Tool | Best for | Skill level | AI drafts | Free plan | Lowest paid plan (annual billing) |
|---|---|---|---|---|---|
| Canva | Fast, varied designs | Beginner | Yes, Magic Studio tools | Yes | $144/year for one person (about $12/month) |
| Visme | Branded infographics and reports | Beginner to intermediate | Yes, AI Design Generator | Yes | $12.25/month per person |
| Piktochart | Small teams on a budget | Beginner | Yes, from prompts or documents | Yes, 2 PNG downloads | $10/member/month |
| Venngage | Business and report-style infographics | Beginner | Yes, from text or files | Yes | $10/month |
| Infogram | Interactive charts and live data | Intermediate | Promoted on its homepage | Yes, non-commercial only | $19/month |
| Adobe Express | Quick graphics inside Adobe's ecosystem | Beginner | Yes, generative AI | Yes | Check Adobe's page |
How We Compared These Tools
We read each vendor's pricing page, feature pages, AI pages, integration directory, and help documentation, and captured each homepage in November 2026. We did not run controlled tests of every feature, so treat this as a buyer's guide, not a lab review.
We judged each tool on five questions:
- Free plan. Can you finish and export a real infographic without paying?
- Data handling. Can you build accurate charts from your own numbers?
- AI. Does the AI produce an editable draft, or only generate images and copy?
- Brand and team control. Can a team lock fonts, colors, and logos?
- Price. What does the first paid tier cost per person?
The Best Infographic Makers, Reviewed
Each review follows the same order, so you can compare tools section by section.
Canva
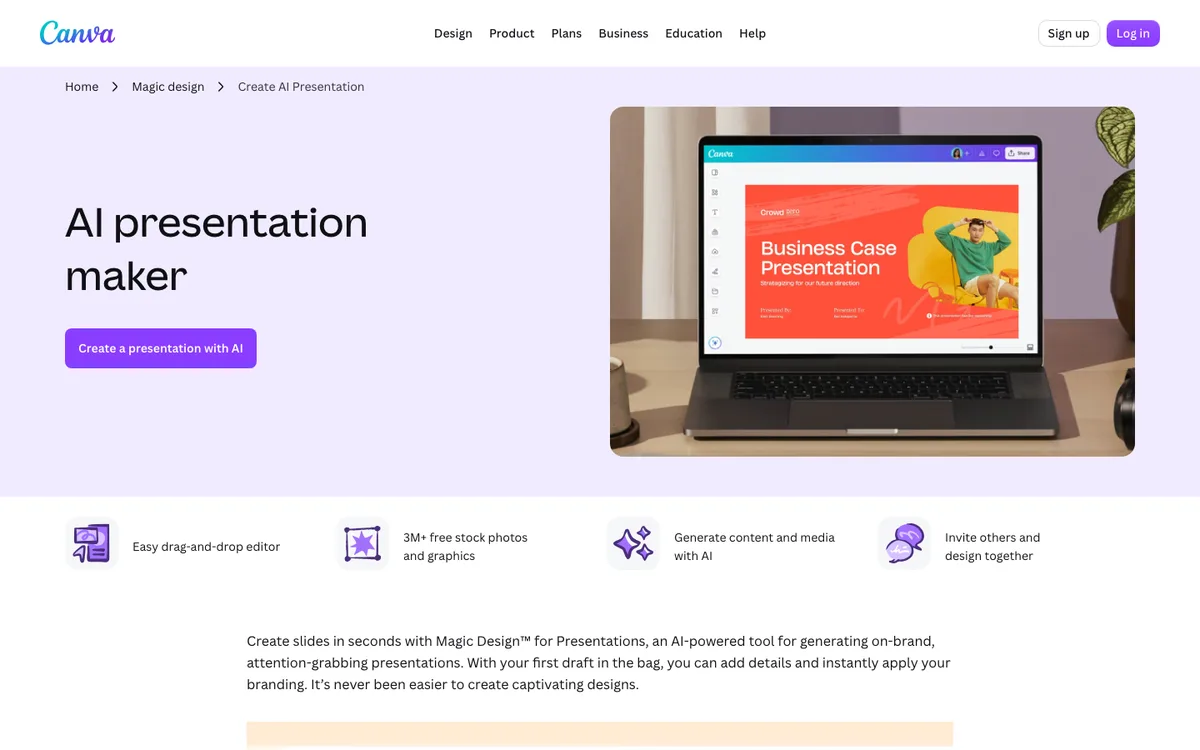
Canva is the easiest starting point if you want fast results and a huge template library. It handles infographics, social posts, and presentations in one editor, so the same brand colors carry across everything.
How it works: You pick a template, then drag, drop, and swap text, icons, and photos. Canva's Charts tool adds bar charts, line graphs, pictograms, and pie charts that you can restyle to match the design.
Best for: Marketers and social teams who need many good-looking graphics quickly, with a handful of numbers in each.
Skills required: None to start. The skill that matters is restraint: Canva makes it easy to add one more icon, and most weak Canva infographics have too many.
AI features: Canva groups its AI tools under Magic Studio. Its infographic page lists tools such as Magic Edit, which changes images from a short prompt, and AI that generates text and media inside a design.
Integrations: On Canva Business or Enterprise plans, you can drop interactive Flourish charts into a Canva design, according to Flourish's pricing page. That fills Canva's biggest gap, live and interactive data.
Pricing: Canva Pro costs $144 per year for one person (about $12 a month) on Canva's US pricing page. Canva also has a free plan.
Watch out for: Data depth. Canva is built for visual infographics with a few numbers, not large datasets or live charts.
Visme
Visme is a strong pick for teams that turn the same assets into infographics, reports, and presentations, and need them to look on-brand every time.
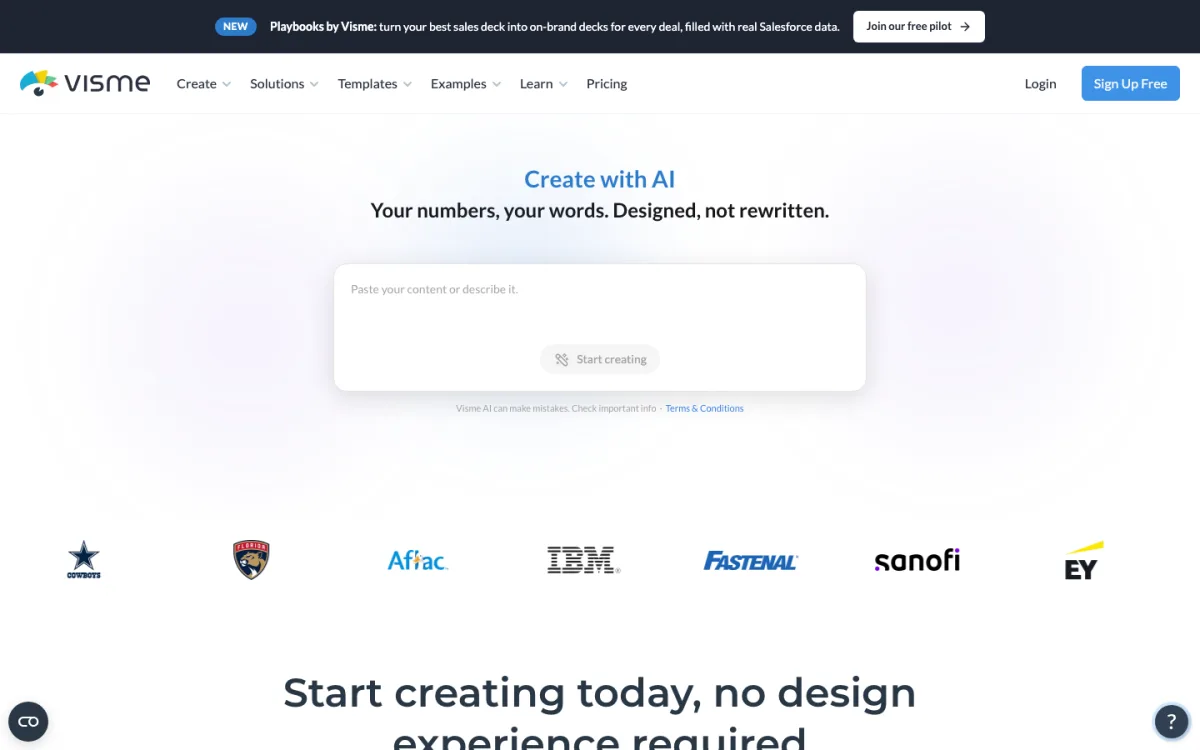
How it works: You start from a template or a blank project, then build with charts, data widgets, icons, and maps. Brand kits keep fonts, colors, and logos consistent across a team.
Best for: Marketing and internal communications teams who produce reports and infographics from the same brand system.
Skills required: Beginner to intermediate. The editor offers more controls than Canva, which pays off once you learn it.
AI features: Visme's AI Design Generator lives inside the template library and turns a prompt into a design. Visme says free accounts get 10 credits and each design generation costs 3, so the free plan covers a few tries.
Integrations: Visme's integration directory lists Google Drive, Dropbox, Mailchimp, Slack, monday.com, Salesforce, and Zapier. It lists HubSpot as an upcoming integration.
Pricing: According to Visme's pricing page, Basic is free, Starter is $12.25 per month per person ($147 billed yearly), and Business is $24.75 per month per person ($297 billed yearly).
Watch out for: The free plan limits templates, assets, and download options, and brand controls sit in the pricier Business tier.
Piktochart
Piktochart suits small teams that want infographics, reports, and presentations without a high monthly bill.
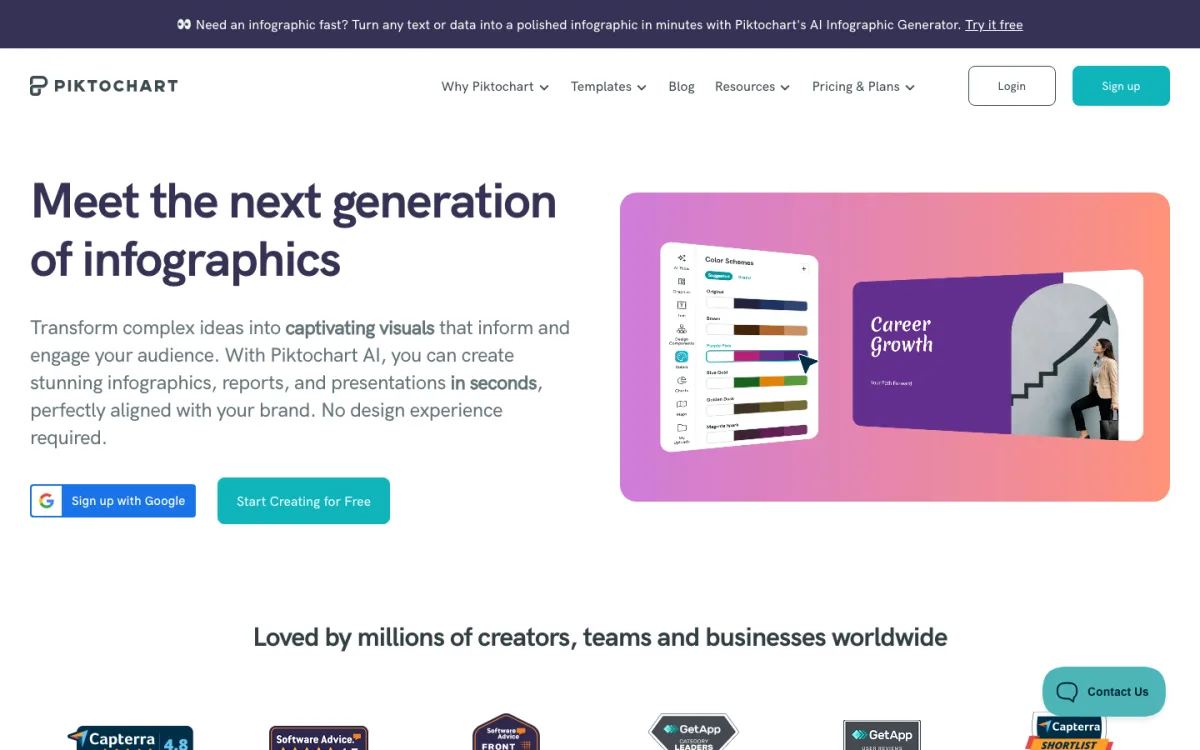
How it works: You describe a topic, paste notes, or upload a document, and Piktochart builds an editable draft. Then you adjust text, colors, icons, fonts, layout, and brand details in the editor.
Best for: Small businesses, educators, and nonprofits that publish infographics regularly on a tight budget.
Skills required: Beginner. The AI draft handles structure, so the main skill is editing it down.
AI features: Piktochart's AI infographic generator works from prompts, notes, or uploaded content and suggests an outline and layout. The free plan includes 60 AI credits a month.
Integrations: We didn't find a public integration directory, so plan on exporting and uploading files yourself.
Pricing: Piktochart lists Free at $0, Pro at $10 per member per month billed annually ($15 monthly), and Business at $17 per member per month billed annually ($20 monthly).
Watch out for: The free plan allows only 2 PNG downloads, which won't carry a regular publishing schedule.
Venngage
Venngage focuses on business-style infographics, reports, and flowcharts, and it's one of the quickest tools for turning existing documents into a visual.
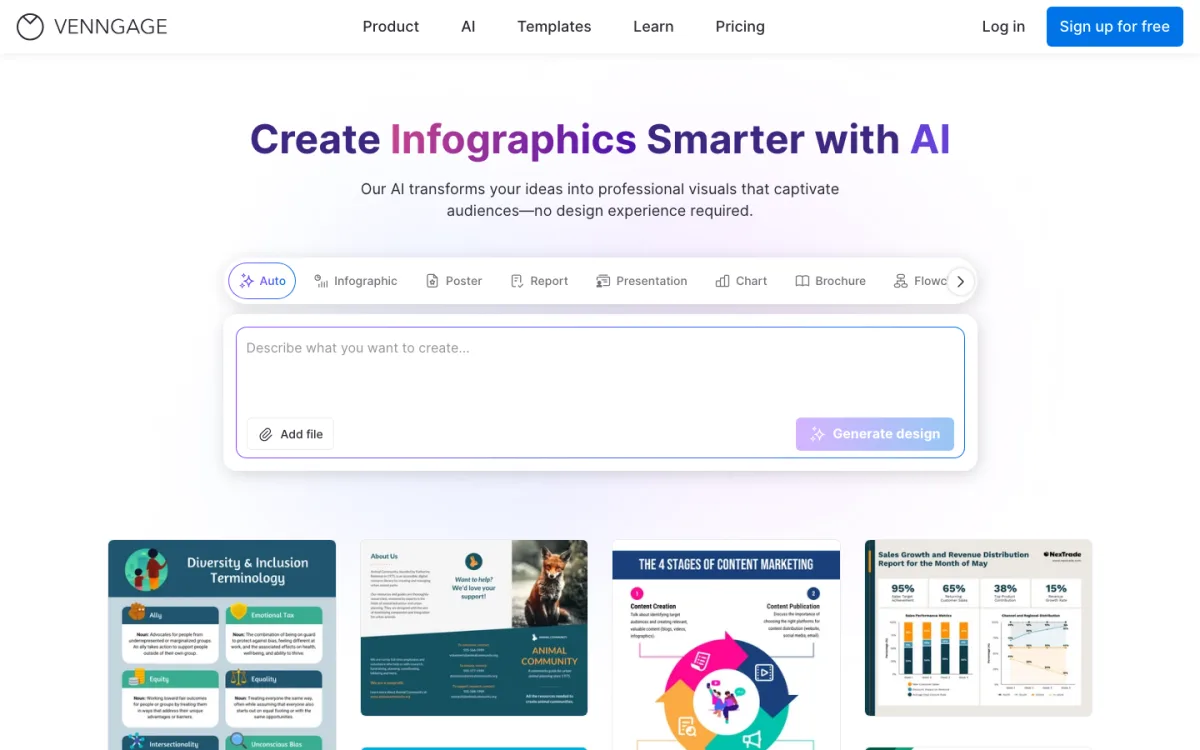
How it works: You paste text, notes, or data, or upload a PDF, Word, Excel, or CSV file, and Venngage generates an editable infographic. You can also start from a large template library.
Best for: Business teams turning reports, survey results, and process documents into shareable graphics.
Skills required: Beginner. Venngage also includes an accessibility checker for contrast and color, which is useful if nobody on your team is a designer.
AI features: Venngage's AI infographic generator turns pasted text or uploaded files into an on-brand draft with charts you can edit. Venngage says its free plan includes 80 AI credits a day and up to 5 designs, with no watermark.
Integrations: We didn't find a public integration directory. File uploads are the main way data gets in.
Pricing: Venngage's pricing page shows Premium at $10 per month on yearly billing ($19 monthly) and Business at $24 per user per month on yearly billing ($49 monthly).
Watch out for: Venngage's prices have shifted between its own pages over time, so check the live page and your billing cycle.
Infogram
Infogram is the best fit when your infographic is really a chart, a map, or a small dashboard that needs to live on a web page.
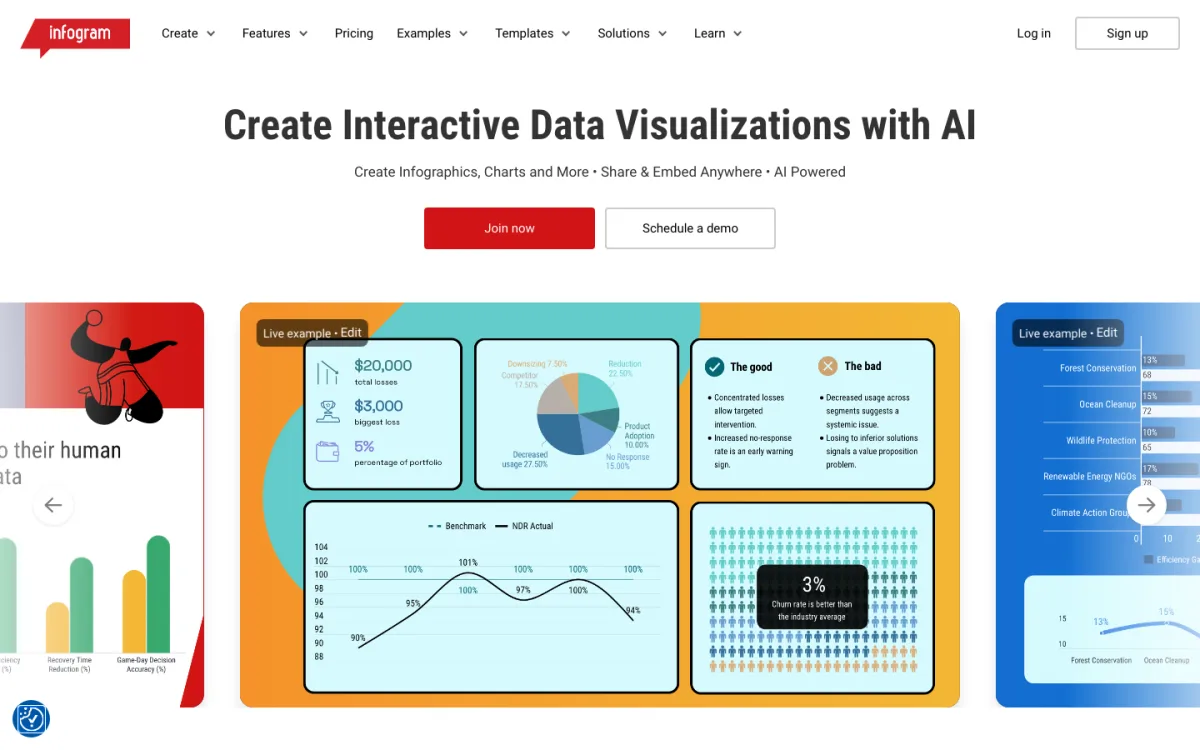
How it works: You import data, pick a chart or map, and publish it as an interactive embed. Infogram supports hover effects, data point animations, and scroll-triggered animations.
Best for: Content teams, analysts, and publishers who embed charts in articles and want them to update.
Skills required: Intermediate. You need clean, well-structured data and a basic sense of which chart fits which question.
AI features: Infogram's homepage now leads with AI-assisted visualizations. We didn't find detailed documentation of what the AI does, so test it on your own data.
Integrations: This is Infogram's strength. Its integrations page lists Google Sheets, Excel, Dropbox, MySQL, and JSON feeds for live data, plus YouTube, Vimeo, and Giphy for media.
Pricing: Infogram lists Pro at $19 per month billed yearly, Business at $67, and Team at $149. Its terms limit the free plan to individual, non-commercial use, and free content is public.
Watch out for: It costs more than the others and favors data graphics over decorative, poster-style layouts.
Adobe Express
Adobe Express fits people who already work in Adobe tools or want a generous free plan for quick graphics.
How it works: You start from a template, customize it with your logo, colors, and fonts, then resize the same design for email, social platforms, and print.
Best for: Creators and small brands that want one tool for infographics, social posts, and flyers.
Skills required: Beginner. Designers who know Photoshop or Illustrator will find the controls familiar.
AI features: Adobe's infographic page promotes fast creation with generative AI inside the editor.
Integrations: It sits inside Adobe's ecosystem, which matters most if your team already pays for Creative Cloud.
Pricing: Adobe's help page lists 100,000+ templates, 4,000+ fonts, and 5 GB of storage on the free plan. Premium features need an upgrade, per Adobe Express pricing. We couldn't verify a current US price, so check Adobe's page.
Watch out for: It's less focused on infographics than Visme or Venngage, so you'll build more from general templates than from data-first layouts.
Lesser-Known Tools for Data-Heavy Infographics
All-round makers handle charts as one feature among many. When the chart is the whole point, these three specialist tools do it better. They're the kind of tools information designers keep beside an all-round maker.
Datawrapper
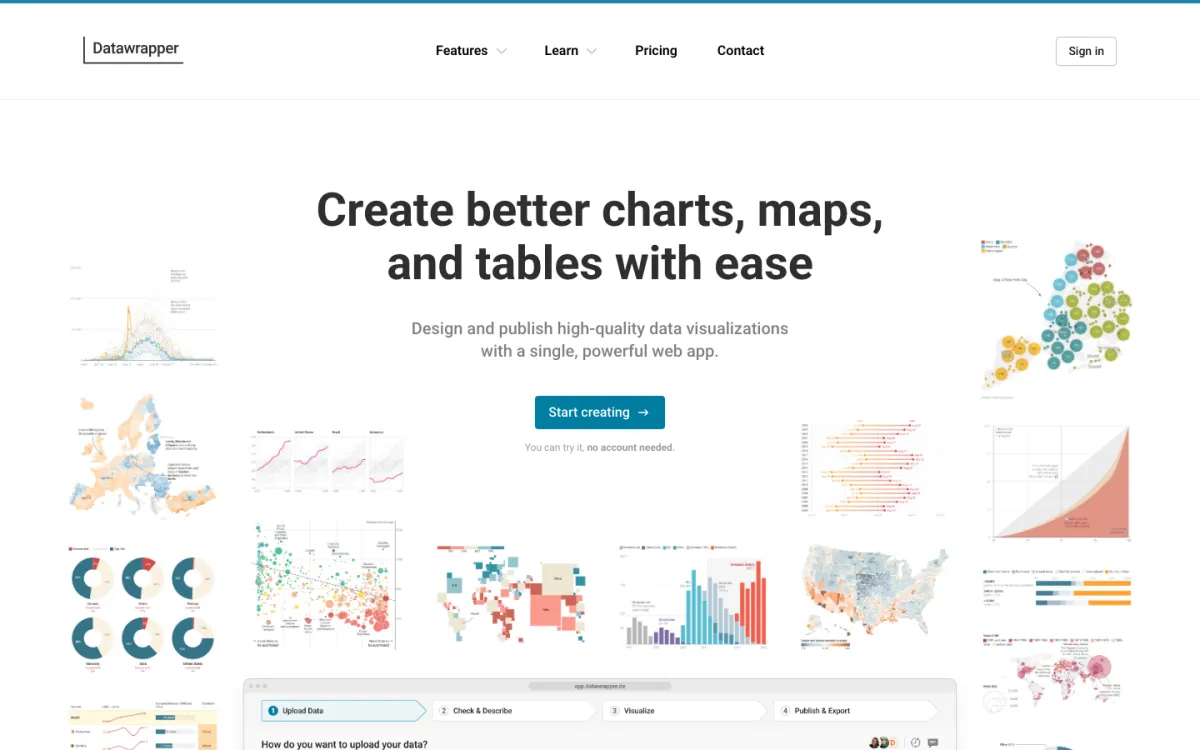
Datawrapper makes clean, accessible charts, maps, and tables that you publish and embed. It's built for accuracy rather than decoration, much like a newspaper chart. Its free plan lets you create and embed interactive charts, maps, and tables and download PNGs. Pro costs $21 per user per month and removes the "Created with Datawrapper" attribution and adds PDF and SVG exports, according to Datawrapper's pricing page. Use it to build the chart, then place it inside a designed infographic.
Flourish
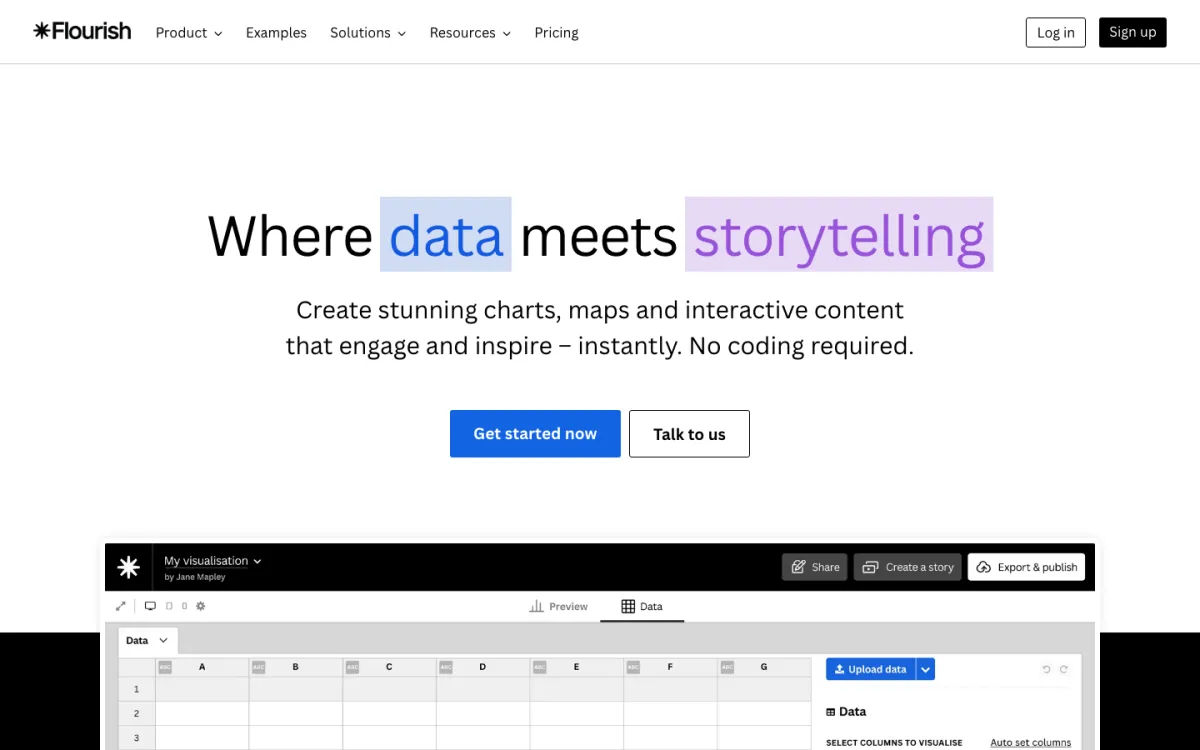
Flourish specializes in interactive data stories: animated charts, maps, and step-by-step visual narratives. Its free plan includes unlimited projects and the full template range, with public publishing and attribution, according to Flourish's pricing page. Through Canva Business or Enterprise, you can add interactive Flourish charts directly to Canva designs. Choose it when your graphic needs motion or interaction to explain change over time.
RAWGraphs
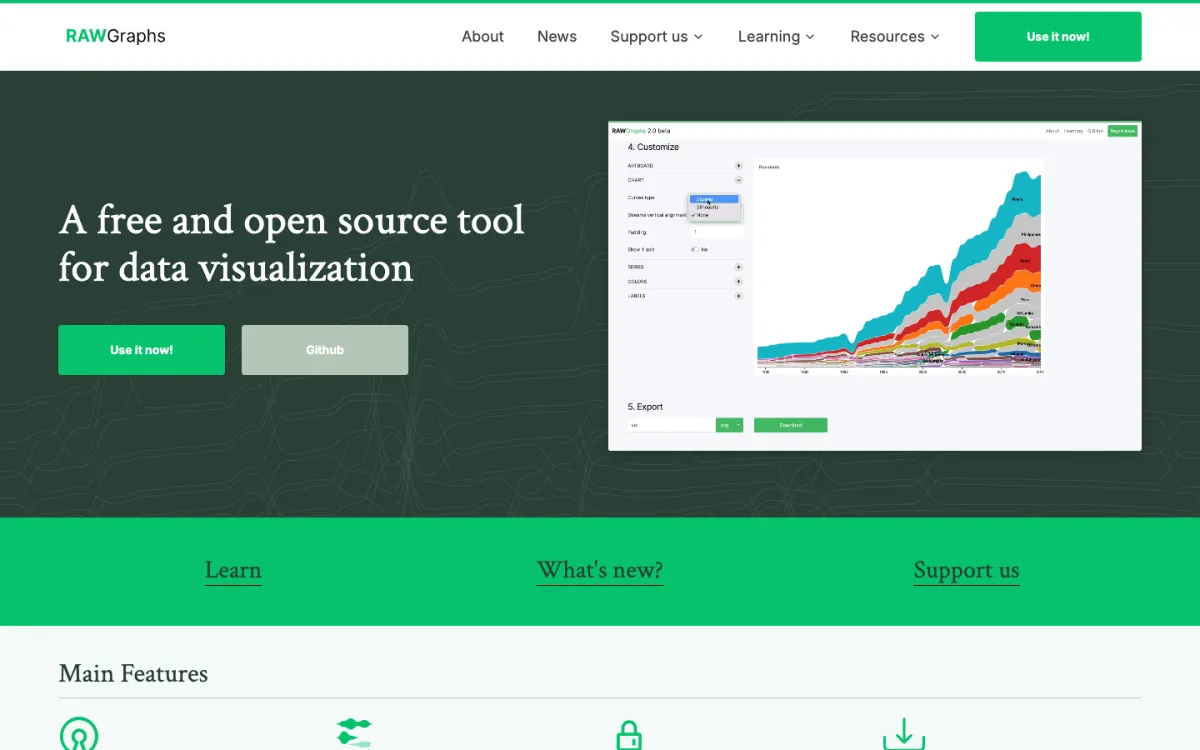
RAWGraphs is a free, open source tool from the DensityDesign Research Lab at Politecnico di Milano, released publicly in 2013. Its about page describes it as a link between spreadsheets and vector editors like Adobe Illustrator, Inkscape, and Figma. You paste data, choose an unusual chart type such as a streamgraph or alluvial diagram, and export a vector file to finish by hand. It's the tool designers reach for when a template chart won't do.
How Does AI Fit Into Infographic Makers?
AI in these tools does two different jobs, and it helps to know which one you're buying.
- Drafting the structure. Venngage, Piktochart, and Visme can turn a prompt or document into an editable layout with sections, icons, and placeholder charts. This saves the blank-page hour.
- Generating assets. Canva's Magic Studio and Adobe Express generate or edit images and text inside a design. This speeds up decoration, not structure.
Neither job replaces judgment. An AI draft will happily give every number the same weight and every section the same size. Check every figure against your source, cut the sections that don't serve the main point, and make the most important number visibly the biggest thing on the page.
What Skills Do You Still Need?
Infographic makers remove the need for drawing skills. They don't remove the need for editorial ones. The strongest infographics we see in the Pineable gallery share three habits:
- One message. Decide the single sentence the graphic proves before you open any tool.
- A clear hierarchy. One dominant number or chart, then supporting points at a smaller size.
- The right chart. Bars for comparisons, lines for change over time, maps only when location matters.
If you're still deciding what to make, browse Pineable's infographic design examples for layouts worth copying. Once you've picked a tool, our infographic design guide walks through layout, charts, and copy.
Free vs Paid Infographic Makers
A free plan is enough for a one-off graphic. It usually isn't enough for a publishing schedule, because free tiers cap downloads, uploads, or commercial use.
- Piktochart Free: 2 PNG downloads and 60 AI credits a month.
- Venngage Free: 80 AI credits a day and up to 5 designs.
- Infogram Free: one user, non-commercial use, public content.
- Visme Basic: limited templates, assets, and downloads.
- Datawrapper Free: unlimited publishing with attribution and PNG downloads.
Paid plans start at $10 to $19 per month for one person, according to the Piktochart, Venngage, and Infogram pricing pages. Costs rise fast for teams, because most vendors bill per member.
How to Choose an Infographic Maker
Start from the job, not the template library. These rules cover most cases:
- Your infographic is mostly charts. Choose Infogram for live, interactive charts, or Datawrapper for clean static and embedded ones.
- You publish often on a tight budget. Choose Piktochart Pro at $10 per member per month, or Venngage Premium at $10 per month.
- You start from existing documents. Venngage and Piktochart turn uploaded files into drafts fastest.
- A team needs brand control. Compare Visme Business and Venngage Business.
- You need speed and variety. Choose Canva, and keep the data simple.
- You want an unusual chart. Build it in RAWGraphs and finish it in Figma or Illustrator.
Pineable's roundup of graphic design software tools covers options beyond infographics.
What is the best free infographic maker?
Canva and Adobe Express are the best free starting points for visual infographics, because both have free plans with large template libraries. For free charts, Datawrapper allows unlimited publishing with attribution.
Is Canva good for making infographics?
Yes, for visual infographics with a handful of numbers. Canva offers fast templates, a Charts tool, and a free plan. It isn't built for large datasets or live charts, so pick Infogram or Datawrapper when your infographic is mostly data.
Can AI make an infographic for me?
AI can draft one. Venngage, Piktochart, and Visme turn prompts or uploaded documents into editable layouts. You still need to check every number, cut what doesn't support the main point, and fix the hierarchy.
Which infographic maker is best for data and charts?
Infogram is the strongest all-round maker for data, with live data connections and interactive embeds. Datawrapper and Flourish are specialist tools that make cleaner or more interactive charts.
Can I use a free infographic maker for commercial work?
Check the tool's terms first. Infogram limits its free plan to non-commercial use, and other tools set their own limits on downloads and attribution.
Do I need design skills to use an infographic maker?
No drawing skills, but you do need editorial ones. Decide the one point your graphic makes, give the most important number the most space, and choose a chart that fits the data.
Summarize this article with AI:
 ChatGPT
 Perplexity
 Claude
 Grok

Written by
Taher BatterywalaFounder & Chief Curator
Taher Batterywala is a creative marketer who loves to write & design content that organically drives conversions. He is the creator of Pineable, the world's first content marketing design inspiration hub. He regularly shares his thoughts about content design, SEO, and marketing. As a true cinephile, he admires movies above anything else.